Tuesday, 27 November 2012

AUDCAD - Analysis

Date: 27/11/2012

Bias: Bearish

Looking at the daily chart, the price has hit resistance T1 and bounced. This made me turn bearish.
The prices retraced 68% (on 1hr chart) and bounced. We go short at current level (1.0389) against stop loss 1.0480 and first target at recent low or 1.0260 (T3 on daily chart). We will move the stoploss to break-even once the price hits 1.0290 (T2 on 4hr chart)
Daily Chart
4hr Chart
1hr Chart

AUDNZD - Analysis

Date: 27/11/2012

Bias: Bullish

The daily price has tested resistance turned support 1.2696(T1 & T4) and showing bounce at it. The first resistance might be 1.2791 (68%) and if it breaks through, next resistance comes at 1.2881(T3).

We should totake shot at long against 1.2660 (T9) and see how it turns out

Daily Chart
4hr Chart

EURGBP - Analysis

Date: 27/11/2012

Bias: Bearish

The longer term trend appears to be bearish (Daily Chart 1). The trend had retraced and broke the rising trendline T1. This T1 should and would prove to be resistance. The daily price rose to T1 and showing reversal candlestick pattern at T1 (Daily Chart 2). And also we have potential head and shoulder pattern.

We will go short at 0.8070 against 0.8120 as stop-loss and first target would be 0.7980

Daily Chart 1
Daily Chart 2
4hr Chart


Monday, 26 November 2012

EURAUD - Analysis

Date: 27/11/2012

Bias: Bullish

We are in uptrend and coming off from a 50% retracement. I will look to go long
Daily chart

There is not much on four hour chart at the moment.

4hr Chart
However, we see a flag/rectangle on 1hr chart. I will go long at the bottom of the range with expectation towards break higher. And When the break of 1.2420/30occurs, I will take one more long position with stoploss below lower end of the range.
1hr chart
Position 1:
Long @ 1.2390 -> OPEN
SL: 1.2350
Target: Open:

Position 2: PENDING
Long @ at 1.2420 after break of 1.2430
SL: 1.2370
Target: Open


Sunday, 25 November 2012

AUDCHF - Analysis

Date: 26/11/2012

The price has reversed from 50% retracement on daily chart and I hope and assume the downtrend has resumed. I will like to go short at appropriate level.
Chart 1 - Daily chart

Looking at 4hr chart, both the defense of support trendlines is broken. This is in confirmation with daily analysis and direction. We will look to go short at appropriate level.
Chart 2 - 4hr chart

Bias: Short

Entry: Around 0.9750
Stop loss : 0.9825
Target : <Open>
===============================================================
Update: 26/11/2012
Trade - 1
Entry: When short at 0.9712 with RSI hovering at around 60
Stop loss : 0.9830
Target : <Open>
===============================================================
Update - 30/11/2012

The plan layed out  on 26/11/2012 has worked to pip. The price has hit the defined level precisely at 0.9750 before resuming falling. See Chart 3. The RSI on 4 hr chart has entered into oversold level. We will refrain from entering into another trade until this pressure is either released or neutralized.

Chart 3 - 4 hr


NZDUSD - Analysis

Date - 25/11/2012

The price is approaching the resistance on daily chart. We will stay aside to decide bais

Bias - Flat

AUSUSD - Analysis

Date: 25 Nov 2012

We are in a triangle range and price is approaching daily upper resistance. We would stay aside for now to determine the bias

Bias: Flat

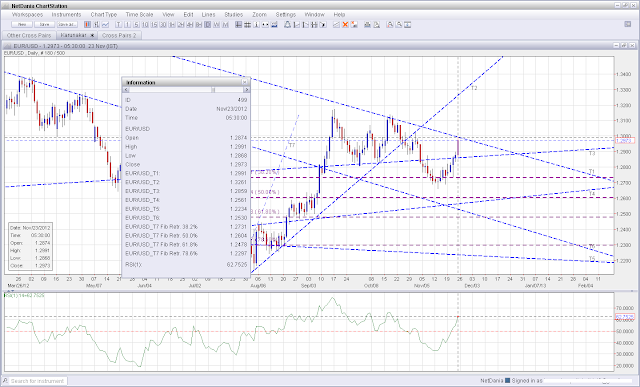
EURUSD - Analysis

Date - 25 Nov 2012


The price had reversed from 38% retracement. The daily price has approached the resistance trendline (T1). We would like to stay aside for now to decide the bias

Bias:Flat