Showing posts with label Chart Patterns. Show all posts
Showing posts with label Chart Patterns. Show all posts
Friday, 17 February 2012
Sunday, 29 January 2012
Rectangles
Rectangle and triangles can serve as continuation or reversal patterns.
You need four points to draw a rectangle. The upper line connects two rally tops and the lower line connects two bottoms. These lines should be draw through the edges of congestion areas rather than the extreme highs and lows.
You need four points to draw a rectangle. The upper line connects two rally tops and the lower line connects two bottoms. These lines should be draw through the edges of congestion areas rather than the extreme highs and lows.
Monday, 23 January 2012
Trends
Trendlines
The most important feature of a trendline is its angle - it identifies the dominant market force.
Most chartists draw a trendline extreme high and low points, but it is better to draw it through the edges of congestion area. Those edges show where the majority of the trades have reversed direction.
When the trendline is broken, it gives the first signal of a trend change. The second signal is given when the price retest the recent high and back away from it. The third signal occurs when the prices break through the previous minor low. It confirms that the uptrend has reversed. A mirror image of this method applies to downtrends.
Rating trendlines
You can rate the importance of any trendline by examining five factors: the time frame of the trendline, its length, the number of times price touch it, its angle and volume (for stocks)
The longer the time frame, the more important the trendline. A trendline on a weekly chart identifies a more important trend than a daily trendline and so on...
The longer the trendline, the more valid it is.
The more the contacts between the prices and the trendline, the more valid that line.
The angle between a trendline and the horizontal axis reflects the emotional intensity of the dominant market crowd. The shallow trendline is likely to last longer.
Sometimes prices accelerate away from trendline. Then you can draw a new, steeper trendline. It shows that a trend is speeding up, becoming unsustainable. When you draw a new steeper trendline, tighten your stop, place it immediately below latest trendline and adjust that stop every new bar. The breaking of a steep trendline is usually followed by a sharp reversal.
Trendline breaks
The breaking of a well-established trendline shows that the dominant market crowd has lost its power. You have to be careful not to anticipate trading signal - most traders lose money when they jump the gun.
A trendline is not a glass floor under the market - one crack and it is gone. It is more like a fence that bulls or bears can lean on. They can even violate it a bit without toppling it, the way animals shake a fence. A trendline break is valid only if prices close on the other side of a trendline. Some traders insists that a trendline has to be penetrated by two or three percentage points of price.
After a very steep uptrend is broken, prices often rally again, retest their old high, and touch their old uptrendline from below. When that happens, you have a near-perfect shorting opportunity: a combination of a double top, a pullback to an old trendline and perhaps a brearish divergence from technical indicators.
The reverse also applies to downtrends.
Trading rules:
1. Trade in the direction of the slope of a trendline. If it points up, look for buying opportunities and avoid shorting. When the slope is down, trade from the short side and avoid buying.
2. A trendline provides support or resistance. When price rise, place a buy order at the uptrendline and protective stops below. Reverse the procedure in downtrends.
3. Steep trendlines precede sharp breaks. If a trendline is steeper than 45 degrees, place your stop right at the trendline and adjust it daily.
4. Prices often retest their latest extreme after breaking a steep trendline. A pullback rally to an old high on falling volume and with indicator divergences provide an excellent shorting opportunity. A decline to older low after a downtrend is broken provides a low-risk buying opportunity.
5. Draw a channel line parallel to a trendline and use it as a target for profit taking.
Trendline Channels
A channel line marks the area of bulls' maximum power in an uptrend and bears' maximum power in a downtrend. The wider the channel, the stronger the trend. It pays to trade in the direction of the channel 's slope, going long in the lower quarter or half of the rising channel and selling in the upper quarter or half of the falling channel. Profits should be taken at the opposite channel wall.
A preliminary trendline
Normally, a trendline touches at least two points on a chart. There is a little known technique for drawing a preliminary trendline through only one point.
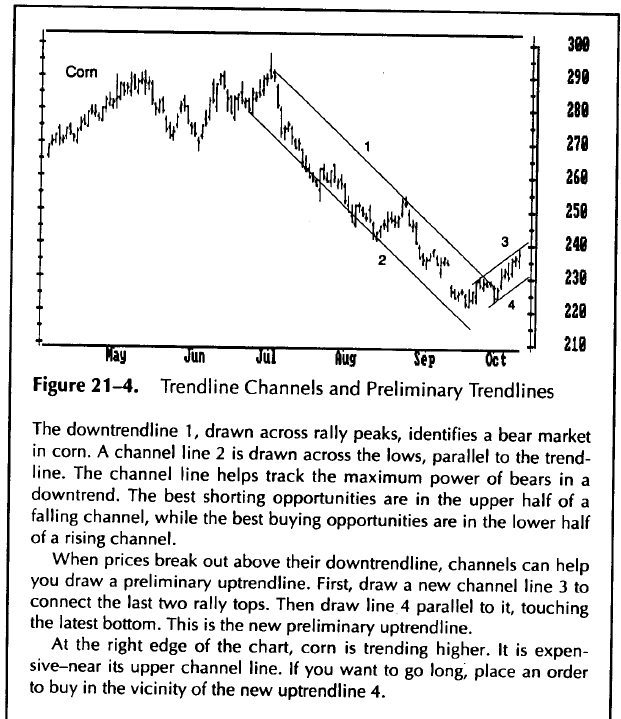
When the price breaks their downtrend and rally above it, you can assume that the downtrend has ended and new uptrend may begin. Connect the two latest peaks - this is the channel of the new uptrend. Draw a line parallel to it through the latest low. This preliminary uptrend, drawn parallel to a channel line, tells you where to expect next bottom. It often points to excellent buying opportunities. This procedure tends to work better at bottom than at the tops.
Trendlines can also be applied to indicators. Among technical indicators, the Relative Strength Index is especially well suited for trend analysis. It often breaks its trendline in advance of prices, providing an early warning of a trend change.
The most important feature of a trendline is its angle - it identifies the dominant market force.
Most chartists draw a trendline extreme high and low points, but it is better to draw it through the edges of congestion area. Those edges show where the majority of the trades have reversed direction.
When the trendline is broken, it gives the first signal of a trend change. The second signal is given when the price retest the recent high and back away from it. The third signal occurs when the prices break through the previous minor low. It confirms that the uptrend has reversed. A mirror image of this method applies to downtrends.
Rating trendlines
You can rate the importance of any trendline by examining five factors: the time frame of the trendline, its length, the number of times price touch it, its angle and volume (for stocks)
The longer the time frame, the more important the trendline. A trendline on a weekly chart identifies a more important trend than a daily trendline and so on...
The longer the trendline, the more valid it is.
The more the contacts between the prices and the trendline, the more valid that line.
The angle between a trendline and the horizontal axis reflects the emotional intensity of the dominant market crowd. The shallow trendline is likely to last longer.
Sometimes prices accelerate away from trendline. Then you can draw a new, steeper trendline. It shows that a trend is speeding up, becoming unsustainable. When you draw a new steeper trendline, tighten your stop, place it immediately below latest trendline and adjust that stop every new bar. The breaking of a steep trendline is usually followed by a sharp reversal.
Trendline breaks
The breaking of a well-established trendline shows that the dominant market crowd has lost its power. You have to be careful not to anticipate trading signal - most traders lose money when they jump the gun.
A trendline is not a glass floor under the market - one crack and it is gone. It is more like a fence that bulls or bears can lean on. They can even violate it a bit without toppling it, the way animals shake a fence. A trendline break is valid only if prices close on the other side of a trendline. Some traders insists that a trendline has to be penetrated by two or three percentage points of price.
After a very steep uptrend is broken, prices often rally again, retest their old high, and touch their old uptrendline from below. When that happens, you have a near-perfect shorting opportunity: a combination of a double top, a pullback to an old trendline and perhaps a brearish divergence from technical indicators.
The reverse also applies to downtrends.
Trading rules:
1. Trade in the direction of the slope of a trendline. If it points up, look for buying opportunities and avoid shorting. When the slope is down, trade from the short side and avoid buying.
2. A trendline provides support or resistance. When price rise, place a buy order at the uptrendline and protective stops below. Reverse the procedure in downtrends.
3. Steep trendlines precede sharp breaks. If a trendline is steeper than 45 degrees, place your stop right at the trendline and adjust it daily.
4. Prices often retest their latest extreme after breaking a steep trendline. A pullback rally to an old high on falling volume and with indicator divergences provide an excellent shorting opportunity. A decline to older low after a downtrend is broken provides a low-risk buying opportunity.
5. Draw a channel line parallel to a trendline and use it as a target for profit taking.
Trendline Channels
A channel line marks the area of bulls' maximum power in an uptrend and bears' maximum power in a downtrend. The wider the channel, the stronger the trend. It pays to trade in the direction of the channel 's slope, going long in the lower quarter or half of the rising channel and selling in the upper quarter or half of the falling channel. Profits should be taken at the opposite channel wall.
A preliminary trendline
Normally, a trendline touches at least two points on a chart. There is a little known technique for drawing a preliminary trendline through only one point.
When the price breaks their downtrend and rally above it, you can assume that the downtrend has ended and new uptrend may begin. Connect the two latest peaks - this is the channel of the new uptrend. Draw a line parallel to it through the latest low. This preliminary uptrend, drawn parallel to a channel line, tells you where to expect next bottom. It often points to excellent buying opportunities. This procedure tends to work better at bottom than at the tops.
Trendlines can also be applied to indicators. Among technical indicators, the Relative Strength Index is especially well suited for trend analysis. It often breaks its trendline in advance of prices, providing an early warning of a trend change.
Trend and Trading Range
When you trade in a trading range, you have to be nimble and close out the position at the slightest sign of reversal. In trading range, buy weakness and sell strength unlike in trends.
Methods and Techniques
There is no single method for identifying trends and trading ranges. There are several methods, and it pays to combine them. When they confirm one another, their message is reinforced. When they contradict one another, it is better to pass up a trade.
1. Analyze the pattern of highs and lows. When the rallies keep reaching higher levels and declines keep stopping at higher level, they identify an uptrend. The pattern of lower lows and lower highs identify a downtrend, and pattern of irregular highs and lows points to a trading range.
2. Draw an uptrendline connecting significant recent lows and a downtrend line connecting significant recent highs. The slope of the latest line identifies the current trend.
3. Plot a 13 day or longer exponential moving average. The direction of its slope identifies the trend. If the moving average has not reached a new high or low in a month, then the market is in a trading range.
4. Several market indicators such as MACD and the directional system (section 27) help identify trends. The directional system is especially good at catching early stages of new trends.
Trade or Wait
Conflicting Timeframes
When you are in doubt about a trend, step back and examine the charts in a timeframe that is larger than the one you are trying to trade.
Sunday, 22 January 2012
Support and Resistance
The strength of every support or resistance zone depends on three factors: its length, its height, and the volume of trading that has taken place in it.
The longer the support or resistance area - its length of time or the number of hits it took - the stronger it is.
The tall the support or resistance zone, the stronger it is.
The greater the volume of trading in a support or resistance zone, the stronger it is.
Trading Rules:
1. Whenever the trend that I am riding approaches support or resistance, I need to tighten my protective stop.
2. Support and resistance are more important on long-term charts than on short-term charts. Weekly charts are more important than dailies. A good trader keeps an eye on several time frames and defers to the longer ones. If weekly trend is sailing through a clear zone, the fact that the daily trend is hitting support or resistance is less important. When a weekly trend approaches support or resistance, I should be more inclined to act.
3. Support and resistance levels are useful for placing stop-loss and protect-profit orders. The bottom of the congestion area is the bottom line support. If you buy and place your stop below that level, you give the uptrend plenty of room. More cautious traders buy after an upside breakout and place a stop in the middle of congestion area. A true upside breakout should not be followed by a pullback into the range. Reverse this procedure in downtrend.
Many trader avoid placing stops at round number.
True and False breakouts
Market spend more time in trading ranges than they do in trends. Most breakouts from trading ranges are false breakouts. They suck in trend-followers just before prices return into trading range. A false breakout is the bane of amateurs, but professional traders love them.
Professionals expect prices to fluctuate without going very far most of the time. They wait till an upside breakout stops reaching new highs or a downside breakout stops making new lows. Then they pounce - they trade the breakout (trade against it) and place a protective stop at the latest extreme point. It is a very tight stop, and their risk is low, while there is a big profit potential from a pullback into the congestion zone. The risk/reward ration is so good that the professional can afford to be wrong half the time and still come out ahead of the game.
The best time to buy and uptrend breakout on a daily chart when your analysis of the weekly chart suggests that an uptrend is developing. True breakouts are confirmed by heavy volume, while the false breakouts tend to have light volume. True breakouts are confirmed when the techical indicators reach new extreme highs or lows in the direction of the trend, while false breakouts are often marked by divergences between prices and indicators.
Subscribe to:
Posts (Atom)