Showing posts with label Daily Analysis. Show all posts

Tuesday, 9 October 2012
Daily Analysis - EURUSD 10/10/2012

The price is nearer to recent trendline support (1.2830)on daily chart. We might as well have a channel on 4hr chart and we are coming to the lower end of the channel.
Daily Chart
4hr chart

If we break 1.2830, the price could reach 1.2740. On the other hand, if it rebounds, it could head towards 1.3000 again.

We need to wait for either break or rebound on 4 hour chart to take bias on the trade
4hr chart


Friday, 10 February 2012

Daily Analysis : AUS/USD -10 Feb 2012

Looking at 1 hr chart,
1. uptrendline (T1) is broken convincingly
2. We are about to break an important support (T2) at 1.0685
3. RSI has dropped below 20.

This makes me turn bearish for time being. I will look to go short using RSI level strategy, preferably, at around 1.0735


Closeup chart.

Sunday, 29 January 2012

Daily Analysis : EUR/USD 30 Jan 2012

The market had retraced to 38% of the fall and also multiple supported turned resistance.
Daily chart


Sunday, 22 January 2012

Daily Analysis : AUS/USD -23 Jan 2012

Consecutive inside days have formed in the AUDUSD. This rare occurrence indicates a contraction in volatility and presents a short term breakout opportunity.


Looking at price it has broken out of congestion area. There appears to be no resistance till 1.0700 or the resistance could be at 1.0522 (78% retracement)
We will look to buy on dips, especially between 1.0450-1.0425 with stoploss at 1.0375
4hr chart

1hr chart

Daily Analysis : EUR/USD - 23 Jan 2012

The price has rebounded off  78% of previous high. If the price moves above 1.2980, next target could be 1.3070 upside. On the other hand, if it drops below 1.2900, we could look at 1.2850 for next support.
Looking at positive news coming out over the last few days, we look to get long.

Eur/usd 1hr chart
Looking at 4hr chart, the price has broken out of falling channel. This makes it bullish bias The next support is at around 1.2850

4hr chart

Sunday, 15 January 2012

Daily Analysis : EUR/USD - 15 Jan 2012

The downtrend has resumed... We will look to sell at given opportunity.

 EUR/USD  30min  Chart


EUR/USD 8hr chart


EUR/USD 4hr Chart

EUR/USD 1hr Chart

Tuesday, 10 January 2012

Daily Analysis : EUR/AUD - 10 Jan 2012

This pair looks to extremely oversold. Might be ready for relief rally. I will try to upload my analysis later in the day.


Monday, 9 January 2012

Daily Analysis : GBP/USD - 10 Jan 2012

Adding more analysis to Daily Analysis : GBP/USD - 9 Jan 2012, there appears to be resistance at former support (1.5470), however,  I will continue to look to get long on shorter time frame signals with the hope that this resistance will be broken.
GBP/USD 1hour chart

Daily Analysis : EUR/USD - 10 Jan 2012

The short term trend might have shifted to upside. We will look to get long on shorter time frame.

EUR/USD 2hr chart

Sunday, 8 January 2012

Daily Analysis : AUS/USD - 9 Jan 2012

There is a good chance of bounce towards 1.0350
Details are in 8 hour chart below
AUS/USD 8hr chart


Few more details in 2 hour chart below...
AUD/USD 2hr chart


Our initial bias would be to go long at opportunity on shorter time frame unless proven otherwise

Daily Analysis : GBP/USD - 9 Jan 2012

Continuing analysis further after Daily Analysis : GBP/USD - 5 Jan 2012, the price has touched strong support line and has bounced to an extent as you can see in following 2 charts

8 hour chart


Closer look at 8 hour chart.


We look to take long position based on shorter time frame. Explanation is on 1 hour chart below.


There is an alternate scenario possible as per daily chart. Explanation is on daily chart below


Daily Analysis : EUR/USD - 9 Jan 2012

This is in continuation with http://karunakarp.blogspot.com/2012/01/daily-analysis-eurusd-3-jan-2012.html. The price has been falling for last 3 days.

The price is about to reach bottom end of the channel on 4 hr chart (same can be seen on 8 hr chart). We can expect either temporary rally up or consolidation for some time. It will be clear in coming sessions.

In the second scenario, if the price manages to break  below 1.2600 in Europe session, it could accelerate towards 1.2000.
Coming few sessions would give us direction for the trade bias.


2 hour chart...

Little more detailed 2 hr chart


1 hour chart...


Wednesday, 4 January 2012

Daily Analysis : AUS/USD - 5 Jan 2012

More details yet to come...


Uploaded with ImageShack.us

Daily Analysis : GBP/USD - 5 Jan 2012

On 8 hr chart, the price looks to be bouncing off upper channel line. I would like to short at opportunities on shorter time frame.


Daily Analysis : EUR/USD - 3 Jan 2012

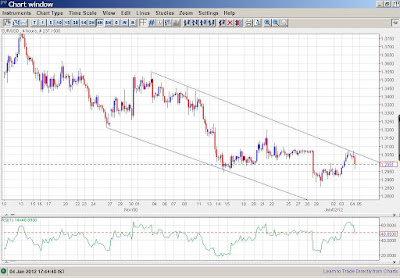
We are pretty much sure that we are in down trend looking at daily chart. No marks for guessing...


However, it gets interesting when we look at 8hr chart. As you can see from screen below, the price has just bounced off upper trendline which is down trend channel. It might go till 2655 (T2)

Even 4hr chart says the same thing.


I would look to short on retracements with target 2700 on 8hr chart. To start with, I will look for 2960 (38%) retracement to open short position with SL at  recent high 1.3080. This offers me R/R ration of 1:2