Showing posts with label Things to remember. Show all posts

Tuesday, 21 February 2012

Rule Scores

Rule Scores

Score book:

Sr

Guideline/Rule

(+)ve

(-)ve

1

 Once the trade goes to 30 pips in favor, move the stop loss to break even

2

1

2

 First day of the trade should be in the direction of recent strong trend

5

0

3

 Wait for RSI and candlestick reversal pattern on 1hr chart before taking a trade

3

0

4

When RSI reaches OB/OS, watch out break of recent trendline on 5 mins chart to enter/exit trade

3

0

5

 Have plan for 'what if I am wrong' situations.

4

0

6

Monthly pivot points have strength

1

0

7

You can take RSI strategy if the setup is correct even when you are going into weekend closure

2

0

8

When RSI is in oversold area and the price is near trendline support or any other support, do not short and vice verse

2

0

9

Do not take trade against the trend

3

0

10

Be aware of news announcements

2

0

11

When there is no clear target, use fib levels to decide

-

-

12

Profit from #11 overcomes, losses from it on any given day

0

1

13

Once asian session’s support is broken, the move is significant

2

1

14

Close the trade if the trade did not work out in the estimated time period

1

0

15

Stop trading for the day if you have 2 trades in losses or 70 pips in total

1

0


Sr

Strategy

(+)ve

(-)ve

1

 Reduce risk strategy - score

7

1

 Reduce risk strategy - pips

98

-20

2

My Analysis is correct - score

3

0

My Analysis is correct - pip

255

-11


Monday, 6 February 2012

RSI levels

During range/downtrend...
RSI levels to watch are 60.70/32.10
Support/resistance/trendline
Candlestick pattern.
Only think about short here...
1hr chart

In uptrend
RSI levels to watch are (70-80)/40
Support/resistance/trendline
Candlestick pattern.
Only think about long here

If you have Marubozo (railroad tracks) as reversal, place buy/sell order at 50% of the candle range (Point A int the chart). In other cases, place it at other end (open/close) of the candle.

When RSI touches 20 on 1hr chart, we are in downtrend
When RSI touches 70 and above, we are in uptrend.

Guidelines:
1. Initial stop loss would be 50 pips. Once the price move 30 pips in favor, move the stop loss to break-even, considering target is 50 pips in profit.
2. Once the trade goes to 30 pips in favor, move the stop loss to break even (#1) (+1,0)
3. First day of the trade should be in the direction of recent strong trend (+1,0)
4. Wait for RSI and candlestick reversal pattern before taking a trade.
5. Draw trendlines, support/resistance, fib level, pivot levels on chart in advance.
6. When RSI reaches OB/OS, watch out break of recent trendline on 5 mins chart and enter trade.
7. Have plan for 'what if I am wrong' situations.
8. Monthly pivot points have strength
9. You can take RSI strategy if the setup is correct even when you are going into weekend closure. (#1)
10. Close the trade if the trade did not work out in the estimated time period

Rule Scores

Rules:
1. Don't chase the price.
2. When RSI is in oversold area and the price is near trendline support or any other support, do not short and vice verse (+1,0).
3. Do not take trade against the trend (+1,0)
4. Be aware of news announcements.

Rules to remember:
1. Forget the news, remember the charts
2. But the first pullback from new highs, sell the pullback from new low. There's always a crowd that missed the first boat.
3. Short rallies not selloffs. When markets drop, shorts finally turn a profit and get ready to cover.
4. Don't buy up into a major moving average or sell down into one
5. Sell the second high, buy the second low. After sharp pullbacks, the first test of any high or low always runs into resistance. Look for the break on the third or fourth try.
6. Bulls live above the 200 day, bears live below. Sellers eat up rallies below this key moving average line and buyers to come to the rescue above it.
7. Never overtrade no matter how confident you are and no matter how long your winning streak is.
8. Never add to loosing position
9. Prepare a game plan and stick to it


Monday, 30 January 2012

Checklist for scalp setup

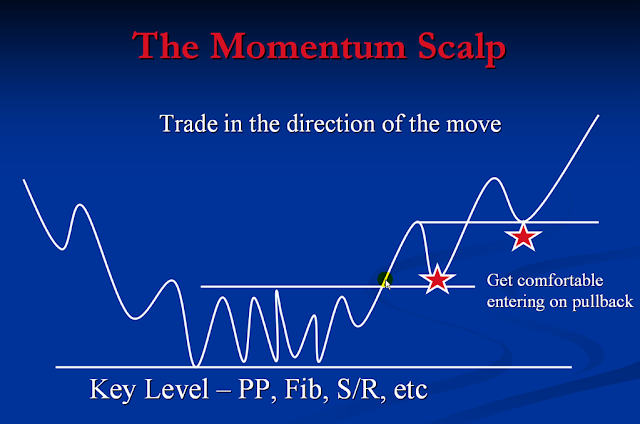
Momentum scalp setup

General Order rules for Momentum Entry
1. When a key level is penetrated, look for the market to retest/bounce at the level and offer a potential trade.
2. Only trade this when the trend is clear.
3. When the market penetrates the level and makes a new high/low, measure the distance from the potential retest level to the high/low that was recently achieved, to assess if there is potential for profit.


How to determine Potential reaction levels
1. Start by observing the previous day's high and low and intraday support and resistance levels on a 15, 30 or 60 min chart.
2. Then move to higher timeframe and note key reaction levels ("Key Levels")
3. Mark Support/Resistance levels, Fibs, Trendlines and Pivot levels
4. Scroll down to the smaller timeframes to watch the market Reaction and stalk the trade.


Trade preparation and Scalping checklist
1. Using your tools, support/resistance, Fibs, pivots, trendlines, etec, establish your near term "Key reaction" levels on a 15 min, 30 mins and/or 1hr chart.
2. Also watch your 5 min chart.
3. Mark the notable key reaction levels on the higher timeframes, in the event it is a strong trending or large ranging day.
4. Stalk the levels and anticipate a trade.
5. Be mindful of any economic reports due in the session ahead
6. Be mindful of time of day. The London and NY sessions are more volatile than the Asian session.
7. #1 Rule - Trade into a bold faced candle that is moving in the direction opposite to the direction of the intended position and trade it at a "Key Reaction Level"
8. Place a reasonably tight stop and move it closer to entry after the market has responded to the key reaction level.
9. Take at least 60% of the position out of the market when 10 pip in profit and move your stop accordingly.
10. It is High Risk! Be careful out there!

Thursday, 12 January 2012

Using Pattern Probability to Trade the trend

90% traders will loose money in the market.

Most traders loose because of following reasons
  1. Lack of discipline
  2. Lack of money management skills
  3. Lack of consistency
It takes years to be successful with trading. Consistency is most important.


  1. We look for long term, medium term and short term trend in the same direction even before consider a trade.
  2. Look for chart patter for entry
  3. Once entered, we work out 2 exist points,  price based and time based
  4. And Money management system.


Pattern #1 - Symmetrical Triangle
We place the trade when the price breaks out of the triangle and place the stop loss at the apex of the triangle

Pattern #2 - Ascending Triangle.
The ascending triangle found in uptrend is more powerful than the one found in downtrend.
<picture to be inserted>

Pattern #3 - Head and Shoulder Pattern
This can be seen as continuation pattern rather than reversal pattern.
Look for failure of the neckline and look to go long above the right shoulder, placing the stoploss between the top of the right shoulder and neckline,

Above 3 patterns have the highest probability out of 9 patterns

Pattern #4 - Rectangle
This can be traded both in uptrend and downtrend. It has more success probability in uptrend.
Take the trade when the price breaks out of it and place stop midway into it.
<Picture to be inserted>

Probability patterns to be traded in downtrend.
Pattern #5- Minor tops
Prerequisite is that we should be in a major downtrend. We will look for minor rally in the context of downtrend and look for patterns such as double tops, head and shoulder tops and a descending triangle.
<Picture to be inserted 41:16>

Pattern #6 - Falling wedge

Pattern #7 - Raising wedge.

Break even rules

  1. Go to break-even when the price goes to twice the risk. It could occur in intraday as well.
  2. 4 day rule - It is based on time. It the target is not reached within the timeframe, close the trade with available profit.

Trailing stops:
Move the stop along with the trendline. If the price move more than the trendline, wait for the price to make swing high/low after the recent sharp movement and then move the stop loss to recent swing high/low
Of the two, the one takes the precedence is the one that locks on maximum profit.

Use re-entry technique if you are stopped out on the trade. Reenter the market at another breakout in the same setup with redrawn pattern.


Tuesday, 10 January 2012

Summary - The disciplined Trader

The Nature of the trading environment from a Psychological perspective
  1. Market is always right.
  2. There is unlimited potential for profit and loss.
  3. Prices are in perpetual motion with No defined beginning or ending.
  4. Market is an unstructured environment
    • If you can't define your own behaviour and that of the markets, you can't learn how to repeat your wins or prevent your losses.
  5. In the market environment, reasons are irrelevant.
The next error after letting a loss get out of hand is usually not taking the next opportunity, which invariably is always a winning trade. After which, we get so angry at ourselves for passing up that opportunity that we make
ourselves susceptible to any number of other trading errors, like taking a trade that was a tip from another trader, which invariably is always a loser.

<<Incomplete>>

Sunday, 8 January 2012

Discipline yourself

1.     Never add to loosing position.
3.     Always place stop-loss.
4.     Don't trade thin market.
5.     Nobody is bigger than the market.
6.     In a Bull market, never sell a dull market, in Bear market, never buy a dull market.
7.     A buy signal that fails is a sell signal. A sell signal that fails is a buy signal.
8.     Let profits run, cut losses short.
9.     Don't trade impulsively; have a plan.
10. Have specific goals and objectives.
11.  Accept that loosing  is part of the game.
12. To help ensure success, practice defensive money managment. A good trader watches his capital as carefully as a professional scuba diver watches his air supply.
13. Keep a trading diary - write down your reasons for entering and exiting every trade. Look for repetitive patterns of success and failure.


14. I can succeed in trading only when I think and act as an individual trader. I will fail when I trade without a plan or deviate from my plan. I have to observe myself and notice changes in my mental states as I trade. I have to write down reasons for entering a trade and the rules for getting out of it, including money management rules. I must not change my plan while I have an open position.


I need to practice conservative money management aimed at long-term survival and profit accumulation. I must observe how my mind works and avoid slipping into greed or fear.


Successful trading stands on three pillars. I need to analyze the balance of power between bulls and bears. I need to practice good money management. I need personal discipline to follow my trading plan and avoid getting high in the markets.

more to come...

Wednesday, 4 January 2012

Reversal to take notice

When you see a reversal like the one you seen in the screenshot below on 1 hour chart at previously known resistance, take the trade with 1:2 risk to reward ration.