Monday, 30 January 2012

Checklist for scalp setup

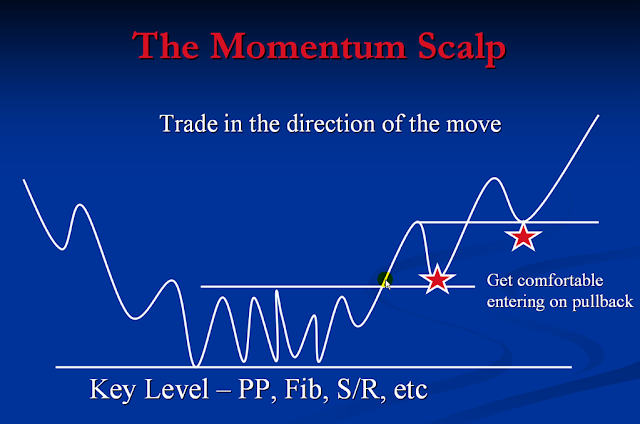
Momentum scalp setup

General Order rules for Momentum Entry
1. When a key level is penetrated, look for the market to retest/bounce at the level and offer a potential trade.
2. Only trade this when the trend is clear.
3. When the market penetrates the level and makes a new high/low, measure the distance from the potential retest level to the high/low that was recently achieved, to assess if there is potential for profit.


How to determine Potential reaction levels
1. Start by observing the previous day's high and low and intraday support and resistance levels on a 15, 30 or 60 min chart.
2. Then move to higher timeframe and note key reaction levels ("Key Levels")
3. Mark Support/Resistance levels, Fibs, Trendlines and Pivot levels
4. Scroll down to the smaller timeframes to watch the market Reaction and stalk the trade.


Trade preparation and Scalping checklist
1. Using your tools, support/resistance, Fibs, pivots, trendlines, etec, establish your near term "Key reaction" levels on a 15 min, 30 mins and/or 1hr chart.
2. Also watch your 5 min chart.
3. Mark the notable key reaction levels on the higher timeframes, in the event it is a strong trending or large ranging day.
4. Stalk the levels and anticipate a trade.
5. Be mindful of any economic reports due in the session ahead
6. Be mindful of time of day. The London and NY sessions are more volatile than the Asian session.
7. #1 Rule - Trade into a bold faced candle that is moving in the direction opposite to the direction of the intended position and trade it at a "Key Reaction Level"
8. Place a reasonably tight stop and move it closer to entry after the market has responded to the key reaction level.
9. Take at least 60% of the position out of the market when 10 pip in profit and move your stop accordingly.
10. It is High Risk! Be careful out there!
Sunday, 29 January 2012

Daily Analysis : EUR/USD 30 Jan 2012

The market had retraced to 38% of the fall and also multiple supported turned resistance.
Daily chart


Rectangles

Rectangle and triangles can serve as continuation or reversal patterns.

You need four points to draw a rectangle. The upper line connects two rally tops and the lower line connects two bottoms. These lines should be draw through the edges of congestion areas rather than the extreme highs and lows.

Monday, 23 January 2012

Trends

Trendlines

The most important feature of a trendline is its angle - it identifies the dominant market force.

Most chartists draw a trendline extreme high and low points, but it is better to draw it through the edges of congestion area. Those edges show where the majority of the trades have reversed direction.

When the trendline is broken, it gives the first signal of a trend change. The second signal is given when the price retest the recent high and back away from it. The third signal occurs when the prices break through the previous minor low. It confirms that the uptrend has reversed. A mirror image of this method applies to downtrends.

Rating trendlines
You can rate the importance of any trendline by examining five factors: the time frame of the trendline, its length, the number of times price touch it, its angle and volume (for stocks)

The longer the time frame, the more important the trendline. A trendline on a weekly chart identifies a more important trend than a daily trendline and so on...

The longer the trendline, the more valid it is.

The more the contacts between the prices and the trendline, the more valid that line.

The angle between a trendline and the  horizontal axis reflects the emotional intensity of the dominant market crowd.  The shallow trendline is likely to last longer.

Sometimes prices accelerate away from trendline. Then you can draw a new, steeper trendline. It shows that a trend is speeding up, becoming unsustainable. When you draw a new steeper trendline, tighten your stop, place it immediately below latest trendline and adjust that stop every new bar. The breaking of a steep trendline is usually followed by a sharp reversal.

Trendline breaks
The breaking of a well-established trendline shows that the dominant market crowd has lost its power. You have to be careful not to anticipate trading signal - most traders lose money when they jump the gun.

A trendline is not a glass floor under the market - one crack and it is gone. It is more like a fence that bulls or bears can lean on. They can even violate it a bit without  toppling it, the way animals shake a fence. A trendline break is valid only if prices close on the other side of a trendline. Some traders insists that a trendline has to be penetrated by two or three percentage points of price.

After a very steep uptrend is broken, prices often rally again, retest their old high, and touch their old uptrendline from below. When that happens, you have a near-perfect shorting opportunity: a combination of a double top, a pullback to an old trendline and perhaps a brearish divergence from technical indicators.
The reverse also applies to downtrends.

Trading rules:

1. Trade in the direction of the slope of a trendline. If  it points up, look for buying opportunities and avoid shorting. When the slope is down, trade from the short side and avoid buying.

2. A trendline provides support or resistance. When price rise, place a buy order at the uptrendline and protective stops below. Reverse the procedure in downtrends.

3. Steep trendlines precede sharp breaks. If a trendline is steeper than 45 degrees, place your stop right at the trendline and adjust it daily.

4. Prices often retest their latest extreme after breaking a steep trendline. A pullback rally to an old high on falling volume and with indicator divergences provide an excellent shorting opportunity. A decline to older low after a downtrend is broken provides a low-risk buying opportunity.

5. Draw a channel line parallel to a trendline and use it as a target for profit taking.

Trendline Channels

A channel line marks the area of bulls' maximum power in an uptrend and bears' maximum power in a downtrend. The wider the channel, the stronger the trend. It pays to trade in the direction of the channel 's slope, going long in the lower quarter  or half of the rising channel and selling in the upper quarter or half of the falling channel. Profits should be taken at the opposite channel wall.

A preliminary trendline
Normally, a trendline touches at least two points on a chart. There is a little known technique for drawing a preliminary trendline through only one point.


When the price breaks their downtrend and rally above it, you can assume that the downtrend has ended and new uptrend may begin. Connect the two latest peaks - this is the channel of the new uptrend. Draw a line parallel to it through the latest low. This preliminary uptrend, drawn parallel to a channel line, tells you where to expect next bottom. It often points to excellent buying opportunities. This procedure tends to work better at bottom than at the tops.

Trendlines can also be applied to indicators. Among technical indicators, the Relative Strength Index is especially well suited for trend analysis. It often breaks its trendline in advance of prices, providing an early warning of a trend change.


Trend and Trading Range

When you trade in a trading range, you have to be nimble and close out the position at the slightest sign of reversal. In trading range, buy weakness and sell strength unlike in trends.

Methods and Techniques
There is no single method for identifying trends and trading ranges. There are several methods, and it pays to combine them. When they confirm one another, their message is reinforced. When they contradict one another, it is better to pass up a trade.

1. Analyze the pattern of highs and lows. When the rallies keep reaching higher levels and declines keep stopping at higher level, they identify an uptrend. The pattern of lower lows and lower highs identify a downtrend, and pattern of irregular highs and lows points to a trading range.

2. Draw an uptrendline connecting significant recent lows and a downtrend line connecting significant recent highs. The slope of the latest line identifies the current trend.

3. Plot a 13 day or longer exponential moving average. The direction of its slope identifies the trend. If the moving average has not reached a new high or low in a month, then the market is in a trading range.

4. Several market indicators such as MACD and the directional system (section 27) help identify trends. The directional system is especially good at catching early stages of new trends.

Trade or Wait


Conflicting Timeframes
When you are in doubt about a trend, step back and examine the charts in a timeframe that is larger than the one you are trying to trade.

Sunday, 22 January 2012

Support and Resistance

The strength of every support or resistance zone depends on three factors: its length, its height, and the volume of trading that has taken place in it.

The longer the support or resistance area - its length of time or the number of hits it took - the stronger it is.

The tall the support or resistance zone, the stronger it is.

The greater the volume of trading in a support or resistance zone, the stronger it is.

Trading Rules:
1. Whenever the trend that I am riding approaches support or resistance, I need to tighten my protective stop.

2. Support and resistance are more important on long-term charts than on short-term charts. Weekly charts are more important than dailies. A good trader keeps an eye on several time frames and defers to the longer ones. If weekly trend is sailing through a clear zone, the fact that the daily trend is hitting support or resistance is less important. When a weekly trend approaches support or resistance, I should be more inclined to act.

3. Support and resistance levels are useful for placing stop-loss and protect-profit orders. The bottom of the congestion area is the bottom line support. If you buy and place your stop below that level, you give the uptrend plenty of room. More cautious traders buy after an upside breakout and place a stop in the middle of congestion area. A true upside breakout should not be followed by a pullback into the range. Reverse this procedure in downtrend.

Many trader avoid placing stops at round number.

True and False breakouts
Market spend more time in trading ranges than they do in trends. Most breakouts from trading ranges are false breakouts. They suck in trend-followers just before prices return into trading range. A false breakout is the bane of amateurs, but professional traders love them.

Professionals expect prices to fluctuate without going very far most of the time. They wait till an upside breakout stops reaching new highs or a downside breakout stops making new lows. Then they pounce - they trade the breakout (trade against it) and place a protective stop at the latest extreme point. It is a very tight stop, and their risk is low, while there is a big profit potential from a pullback into the congestion zone. The risk/reward ration is so good that the professional can afford to be wrong half the time and still come out ahead of the game.

The best time to buy and uptrend breakout on a daily chart when your analysis of the weekly chart suggests that an uptrend is developing. True breakouts are confirmed by heavy volume, while the false breakouts tend to have light volume. True breakouts are confirmed when the techical indicators reach new extreme highs or lows in the direction of the trend, while false breakouts are often marked by divergences between prices and indicators.


Daily Analysis : AUS/USD -23 Jan 2012

Consecutive inside days have formed in the AUDUSD. This rare occurrence indicates a contraction in volatility and presents a short term breakout opportunity.


Looking at price it has broken out of congestion area. There appears to be no resistance till 1.0700 or the resistance could be at 1.0522 (78% retracement)
We will look to buy on dips, especially between 1.0450-1.0425 with stoploss at 1.0375
4hr chart

1hr chart

Daily Analysis : EUR/USD - 23 Jan 2012

The price has rebounded off  78% of previous high. If the price moves above 1.2980, next target could be 1.3070 upside. On the other hand, if it drops below 1.2900, we could look at 1.2850 for next support.
Looking at positive news coming out over the last few days, we look to get long.

Eur/usd 1hr chart
Looking at 4hr chart, the price has broken out of falling channel. This makes it bullish bias The next support is at around 1.2850

4hr chart

Sunday, 15 January 2012

Daily Analysis : EUR/USD - 15 Jan 2012

The downtrend has resumed... We will look to sell at given opportunity.

 EUR/USD  30min  Chart


EUR/USD 8hr chart


EUR/USD 4hr Chart

EUR/USD 1hr Chart

Thursday, 12 January 2012

Using Pattern Probability to Trade the trend

90% traders will loose money in the market.

Most traders loose because of following reasons
  1. Lack of discipline
  2. Lack of money management skills
  3. Lack of consistency
It takes years to be successful with trading. Consistency is most important.


  1. We look for long term, medium term and short term trend in the same direction even before consider a trade.
  2. Look for chart patter for entry
  3. Once entered, we work out 2 exist points,  price based and time based
  4. And Money management system.


Pattern #1 - Symmetrical Triangle
We place the trade when the price breaks out of the triangle and place the stop loss at the apex of the triangle

Pattern #2 - Ascending Triangle.
The ascending triangle found in uptrend is more powerful than the one found in downtrend.
<picture to be inserted>

Pattern #3 - Head and Shoulder Pattern
This can be seen as continuation pattern rather than reversal pattern.
Look for failure of the neckline and look to go long above the right shoulder, placing the stoploss between the top of the right shoulder and neckline,

Above 3 patterns have the highest probability out of 9 patterns

Pattern #4 - Rectangle
This can be traded both in uptrend and downtrend. It has more success probability in uptrend.
Take the trade when the price breaks out of it and place stop midway into it.
<Picture to be inserted>

Probability patterns to be traded in downtrend.
Pattern #5- Minor tops
Prerequisite is that we should be in a major downtrend. We will look for minor rally in the context of downtrend and look for patterns such as double tops, head and shoulder tops and a descending triangle.
<Picture to be inserted 41:16>

Pattern #6 - Falling wedge

Pattern #7 - Raising wedge.

Break even rules

  1. Go to break-even when the price goes to twice the risk. It could occur in intraday as well.
  2. 4 day rule - It is based on time. It the target is not reached within the timeframe, close the trade with available profit.

Trailing stops:
Move the stop along with the trendline. If the price move more than the trendline, wait for the price to make swing high/low after the recent sharp movement and then move the stop loss to recent swing high/low
Of the two, the one takes the precedence is the one that locks on maximum profit.

Use re-entry technique if you are stopped out on the trade. Reenter the market at another breakout in the same setup with redrawn pattern.


Tuesday, 10 January 2012

Summary - The disciplined Trader

The Nature of the trading environment from a Psychological perspective
  1. Market is always right.
  2. There is unlimited potential for profit and loss.
  3. Prices are in perpetual motion with No defined beginning or ending.
  4. Market is an unstructured environment
    • If you can't define your own behaviour and that of the markets, you can't learn how to repeat your wins or prevent your losses.
  5. In the market environment, reasons are irrelevant.
The next error after letting a loss get out of hand is usually not taking the next opportunity, which invariably is always a winning trade. After which, we get so angry at ourselves for passing up that opportunity that we make
ourselves susceptible to any number of other trading errors, like taking a trade that was a tip from another trader, which invariably is always a loser.

<<Incomplete>>

Reading Lamp

Daily Analysis : EUR/AUD - 10 Jan 2012

This pair looks to extremely oversold. Might be ready for relief rally. I will try to upload my analysis later in the day.


Monday, 9 January 2012

Daily Analysis : GBP/USD - 10 Jan 2012

Adding more analysis to Daily Analysis : GBP/USD - 9 Jan 2012, there appears to be resistance at former support (1.5470), however,  I will continue to look to get long on shorter time frame signals with the hope that this resistance will be broken.
GBP/USD 1hour chart

Daily Analysis : EUR/USD - 10 Jan 2012

The short term trend might have shifted to upside. We will look to get long on shorter time frame.

EUR/USD 2hr chart

Sunday, 8 January 2012

Daily Analysis : AUS/USD - 9 Jan 2012

There is a good chance of bounce towards 1.0350
Details are in 8 hour chart below
AUS/USD 8hr chart


Few more details in 2 hour chart below...
AUD/USD 2hr chart


Our initial bias would be to go long at opportunity on shorter time frame unless proven otherwise

Daily Analysis : GBP/USD - 9 Jan 2012

Continuing analysis further after Daily Analysis : GBP/USD - 5 Jan 2012, the price has touched strong support line and has bounced to an extent as you can see in following 2 charts

8 hour chart


Closer look at 8 hour chart.


We look to take long position based on shorter time frame. Explanation is on 1 hour chart below.


There is an alternate scenario possible as per daily chart. Explanation is on daily chart below


Discipline yourself

1.     Never add to loosing position.
3.     Always place stop-loss.
4.     Don't trade thin market.
5.     Nobody is bigger than the market.
6.     In a Bull market, never sell a dull market, in Bear market, never buy a dull market.
7.     A buy signal that fails is a sell signal. A sell signal that fails is a buy signal.
8.     Let profits run, cut losses short.
9.     Don't trade impulsively; have a plan.
10. Have specific goals and objectives.
11.  Accept that loosing  is part of the game.
12. To help ensure success, practice defensive money managment. A good trader watches his capital as carefully as a professional scuba diver watches his air supply.
13. Keep a trading diary - write down your reasons for entering and exiting every trade. Look for repetitive patterns of success and failure.


14. I can succeed in trading only when I think and act as an individual trader. I will fail when I trade without a plan or deviate from my plan. I have to observe myself and notice changes in my mental states as I trade. I have to write down reasons for entering a trade and the rules for getting out of it, including money management rules. I must not change my plan while I have an open position.


I need to practice conservative money management aimed at long-term survival and profit accumulation. I must observe how my mind works and avoid slipping into greed or fear.


Successful trading stands on three pillars. I need to analyze the balance of power between bulls and bears. I need to practice good money management. I need personal discipline to follow my trading plan and avoid getting high in the markets.

more to come...

Daily Analysis : EUR/USD - 9 Jan 2012

This is in continuation with http://karunakarp.blogspot.com/2012/01/daily-analysis-eurusd-3-jan-2012.html. The price has been falling for last 3 days.

The price is about to reach bottom end of the channel on 4 hr chart (same can be seen on 8 hr chart). We can expect either temporary rally up or consolidation for some time. It will be clear in coming sessions.

In the second scenario, if the price manages to break  below 1.2600 in Europe session, it could accelerate towards 1.2000.
Coming few sessions would give us direction for the trade bias.


2 hour chart...

Little more detailed 2 hr chart


1 hour chart...


Things to explore

There are ideas and concepts that I still have to explore. This is the place as reminder to me. Below is the list of those things as of now.
1. Zero balance strategy
2. OOPS

Thursday, 5 January 2012

Trade 2 AUS/USD 5 Jan 2012

I was looking to go short based on analysis http://karunakarp.blogspot.com/2012/01/daily-analysis-aususd-5-jan-2012.html


Updating on 6 Jan 2012:
I had to be away from my computer all day long and NFP was expected today (6 Jan 2012). So I was not in position to watch the marked. I decided to close the trade for around 10 pips of profit

Trade 1 EUR/USD - 5 Jan 2012

I was looking to go short based on analysis http://karunakarp.blogspot.com/2012/01/daily-analysis-eurusd-3-jan-2012.html


Updating on 6 Jan 2012:
I had to be away from my computer all day long and NFP was expected today (6 Jan 2012).  So I was not in position to watch the marked. I decided to close the trade for around  140 pips of profit. However, the price did hit 1.2710 target after NFP announcement.

Wednesday, 4 January 2012

Daily Analysis : AUS/USD - 5 Jan 2012

More details yet to come...


Uploaded with ImageShack.us

Daily Analysis : GBP/USD - 5 Jan 2012

On 8 hr chart, the price looks to be bouncing off upper channel line. I would like to short at opportunities on shorter time frame.


Reversal to take notice

When you see a reversal like the one you seen in the screenshot below on 1 hour chart at previously known resistance, take the trade with 1:2 risk to reward ration.


Daily Analysis : EUR/USD - 3 Jan 2012

We are pretty much sure that we are in down trend looking at daily chart. No marks for guessing...


However, it gets interesting when we look at 8hr chart. As you can see from screen below, the price has just bounced off upper trendline which is down trend channel. It might go till 2655 (T2)

Even 4hr chart says the same thing.


I would look to short on retracements with target 2700 on 8hr chart. To start with, I will look for 2960 (38%) retracement to open short position with SL at  recent high 1.3080. This offers me R/R ration of 1:2